
Google Sheets also has an option to add Geographical Maps to your sheet document. If you have data on the basis of countries or continents you can display that data on a map you can insert a map in Google Sheets and your data will be shown on the map, that you have inserted in your sheet document. You can easily insert Maps in Google Sheets. Also, you can customize, edit, and do more action in your inserted map. You can add a map of your geographical data.
Here are the steps by which you can insert a map into your sheet.
Inserting Geographical Maps in Google Sheets
Google Sheets has an option to insert a geographical map in your sheet document. To insert the map Open your Google sheet document then select the range of data of which you want to make the map. Then click on Insert menu then select the Chart option from the dropdown menu
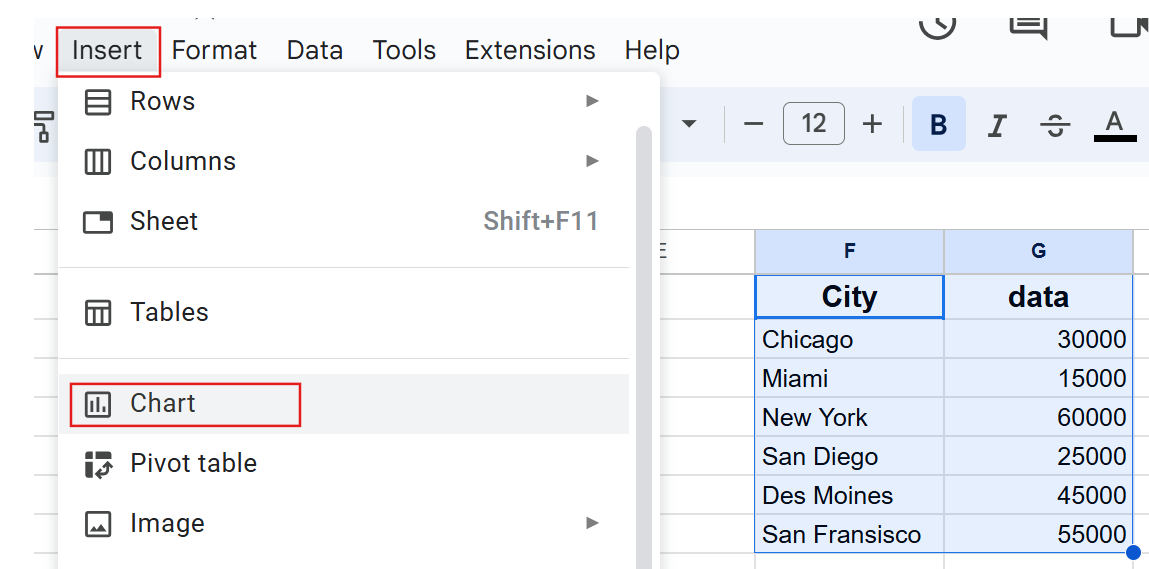
This will add a chart to your sheet, with the default chart type. Now, from the chart editor option change the chart type to Map.
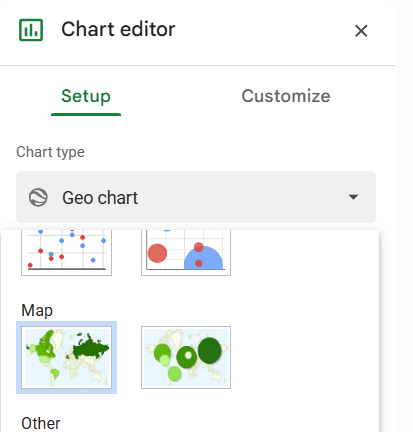
From here you can choose from two types of map charts, Geo Chart and Geo Chart with Markers
Geo Chart: In this type of chart, this function selects the chart and then highlights the whole region of the country or continent.
Geo Chart with Markers: In this type of chart you will see only markers of different colors according to the data range in the map.
Now, a map will be inserted in your sheet.
Customize Map
Now, in the chart editor under the customize option, you will find two options
1. Chart Style
2. Geo 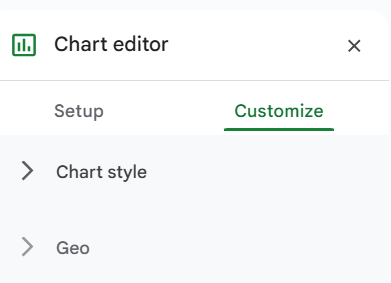
Chart Style
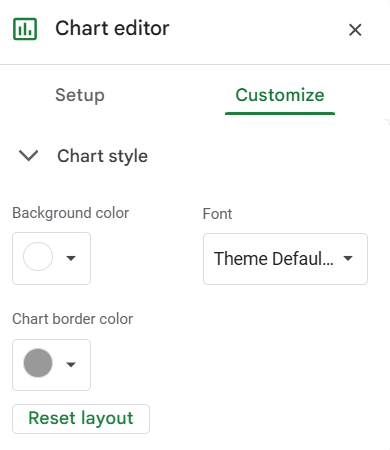
In Chart Style you can change the Background Color, change the Font, you can also add Chart Border Color.
This helps you to make your chart look attractive and catch the view of viewers.
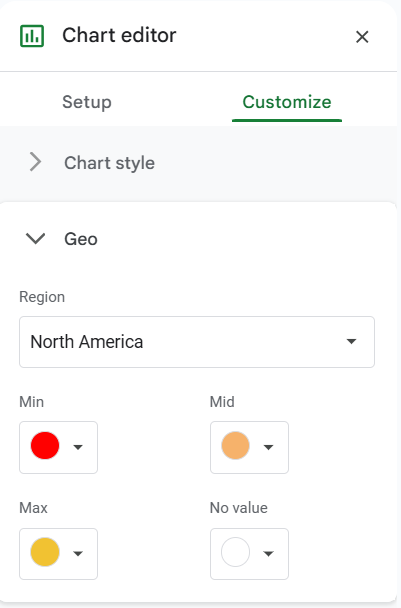
Geo
In the Geo option, you can choose the region of the world of which map you have to create. 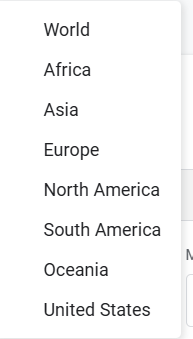
These are the Regions you can make a map of and you can add the data to your map.
You can also set the color for minimum, mid, and maximum values of the range of data selected. and also you can choose a color for the part on the map having no value.
This helps you to identify the data on the map easily.
Adding data In the Map
You can easily add data to the map created in Google Sheets. This is the best feature you have. When you add data in the cell this will automatically update the chart (map).
When you add the data to your in cells in your sheet, then it will automatically be updated in your map with the correct color corresponding to the data you have set in your map the range of cells will be updated now.
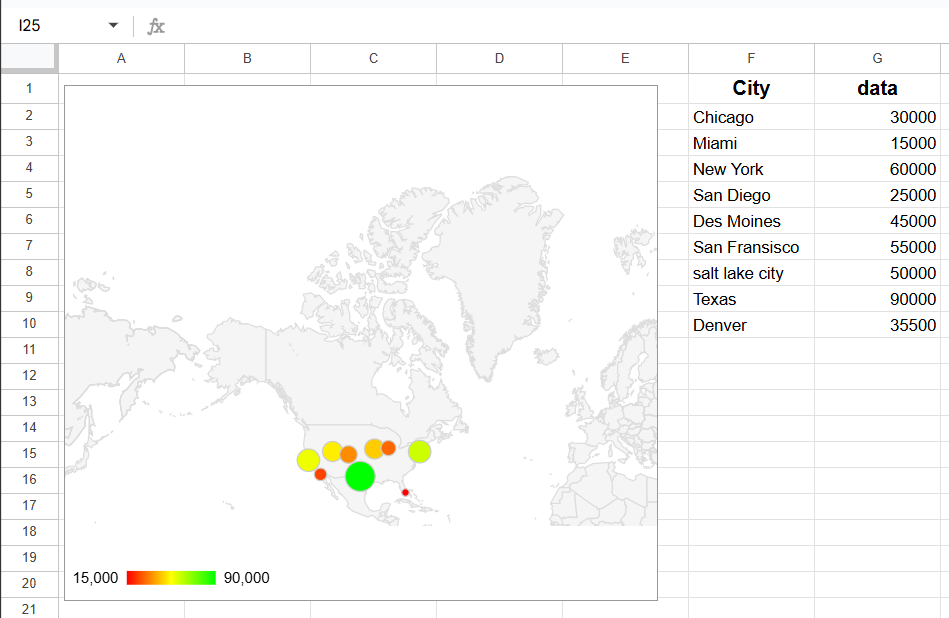
Here, added Denver below the previous data, and it is already updated on the map automatically. It shows on the map with its corresponding color.
Removing Data from the Map
Removing data from the map is just as easy as adding, easy more than adding data, you just have to remove the data from the range of the cell and it will be removed from your map automatically.
Editing the Map
You can easily edit the map by double-clicking on it. The chart editor opens on the right side. Here, under this you can edit the chart according to your choice.
Map Chart Options
To see the additional map chart option click on the 3 dots in the top right corner, A sub-menu appears. 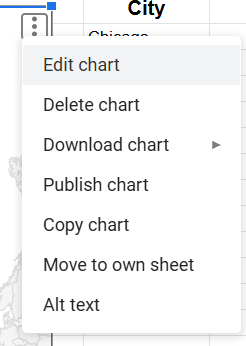
Edit Chart: You can edit the chart using this option.
Delete Chart: This option will delete the chart.
Download Chart: in this option, you can download the chart made by you and save it on your device, also you can put it in another document.
Publish Chart: This helps you to publish the chart or entire document on the web.
Copy Chart: You can copy the chart and paste it anywhere you want.
Move to own Sheet: You can move the chart to any other sheet you have.
Alt Text:
This is all about adding a geographical map to your Google Sheets.